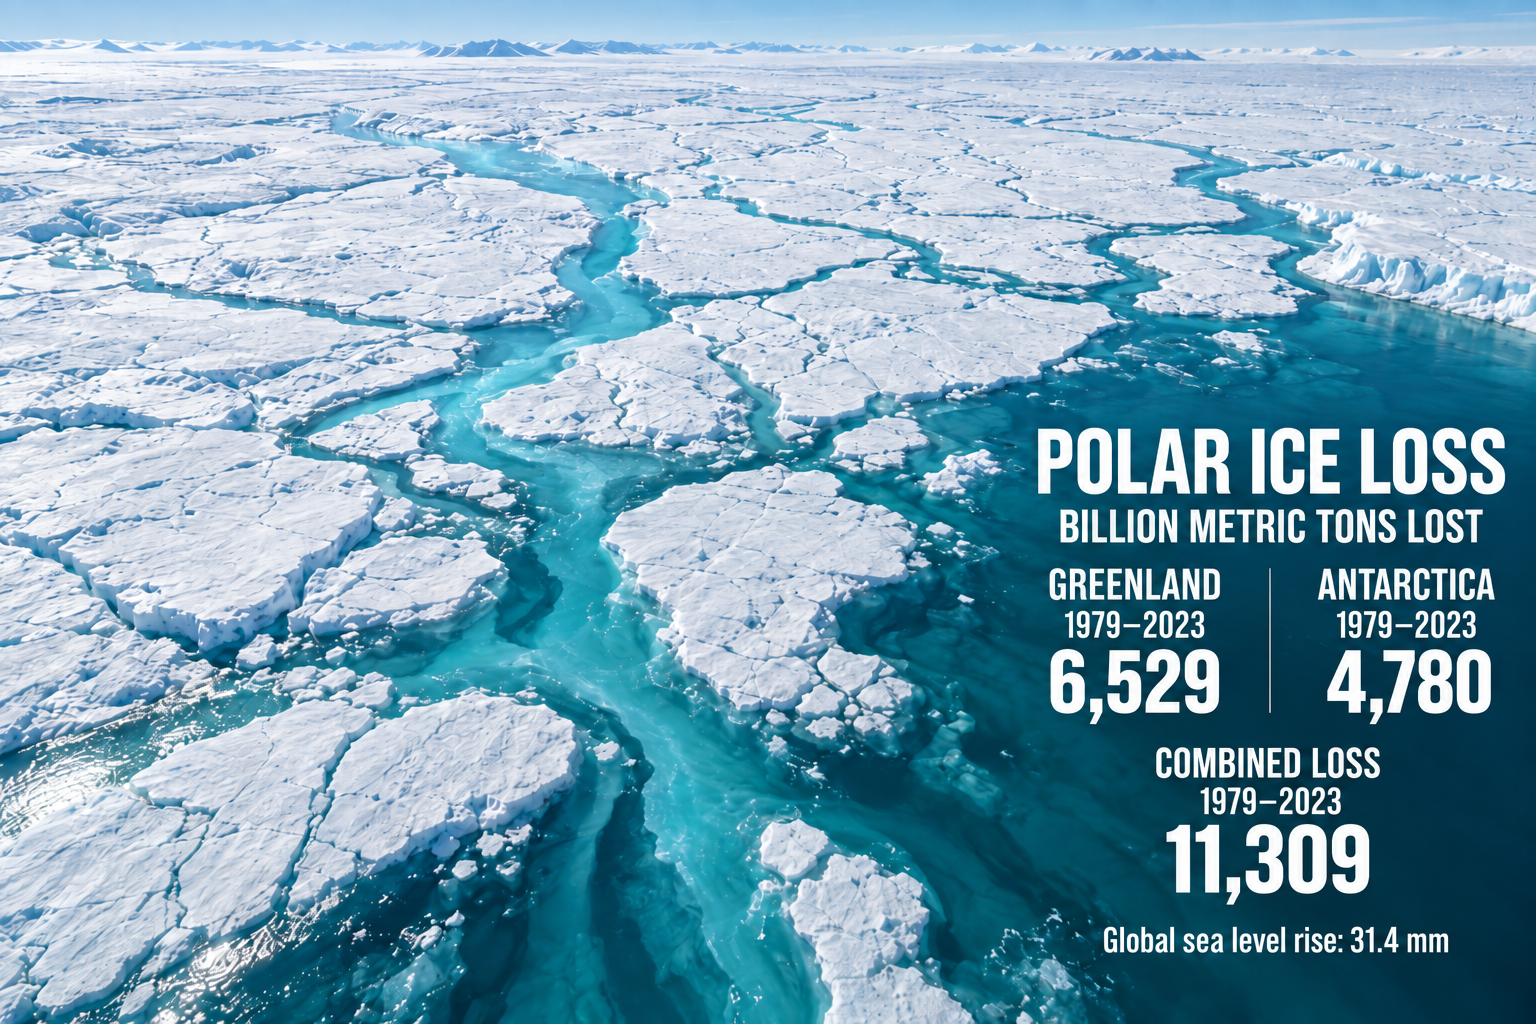
Enough ice has disappeared from Greenland and Antarctica since 1979 to bury the continental United States beneath roughly 5 feet of frozen water.
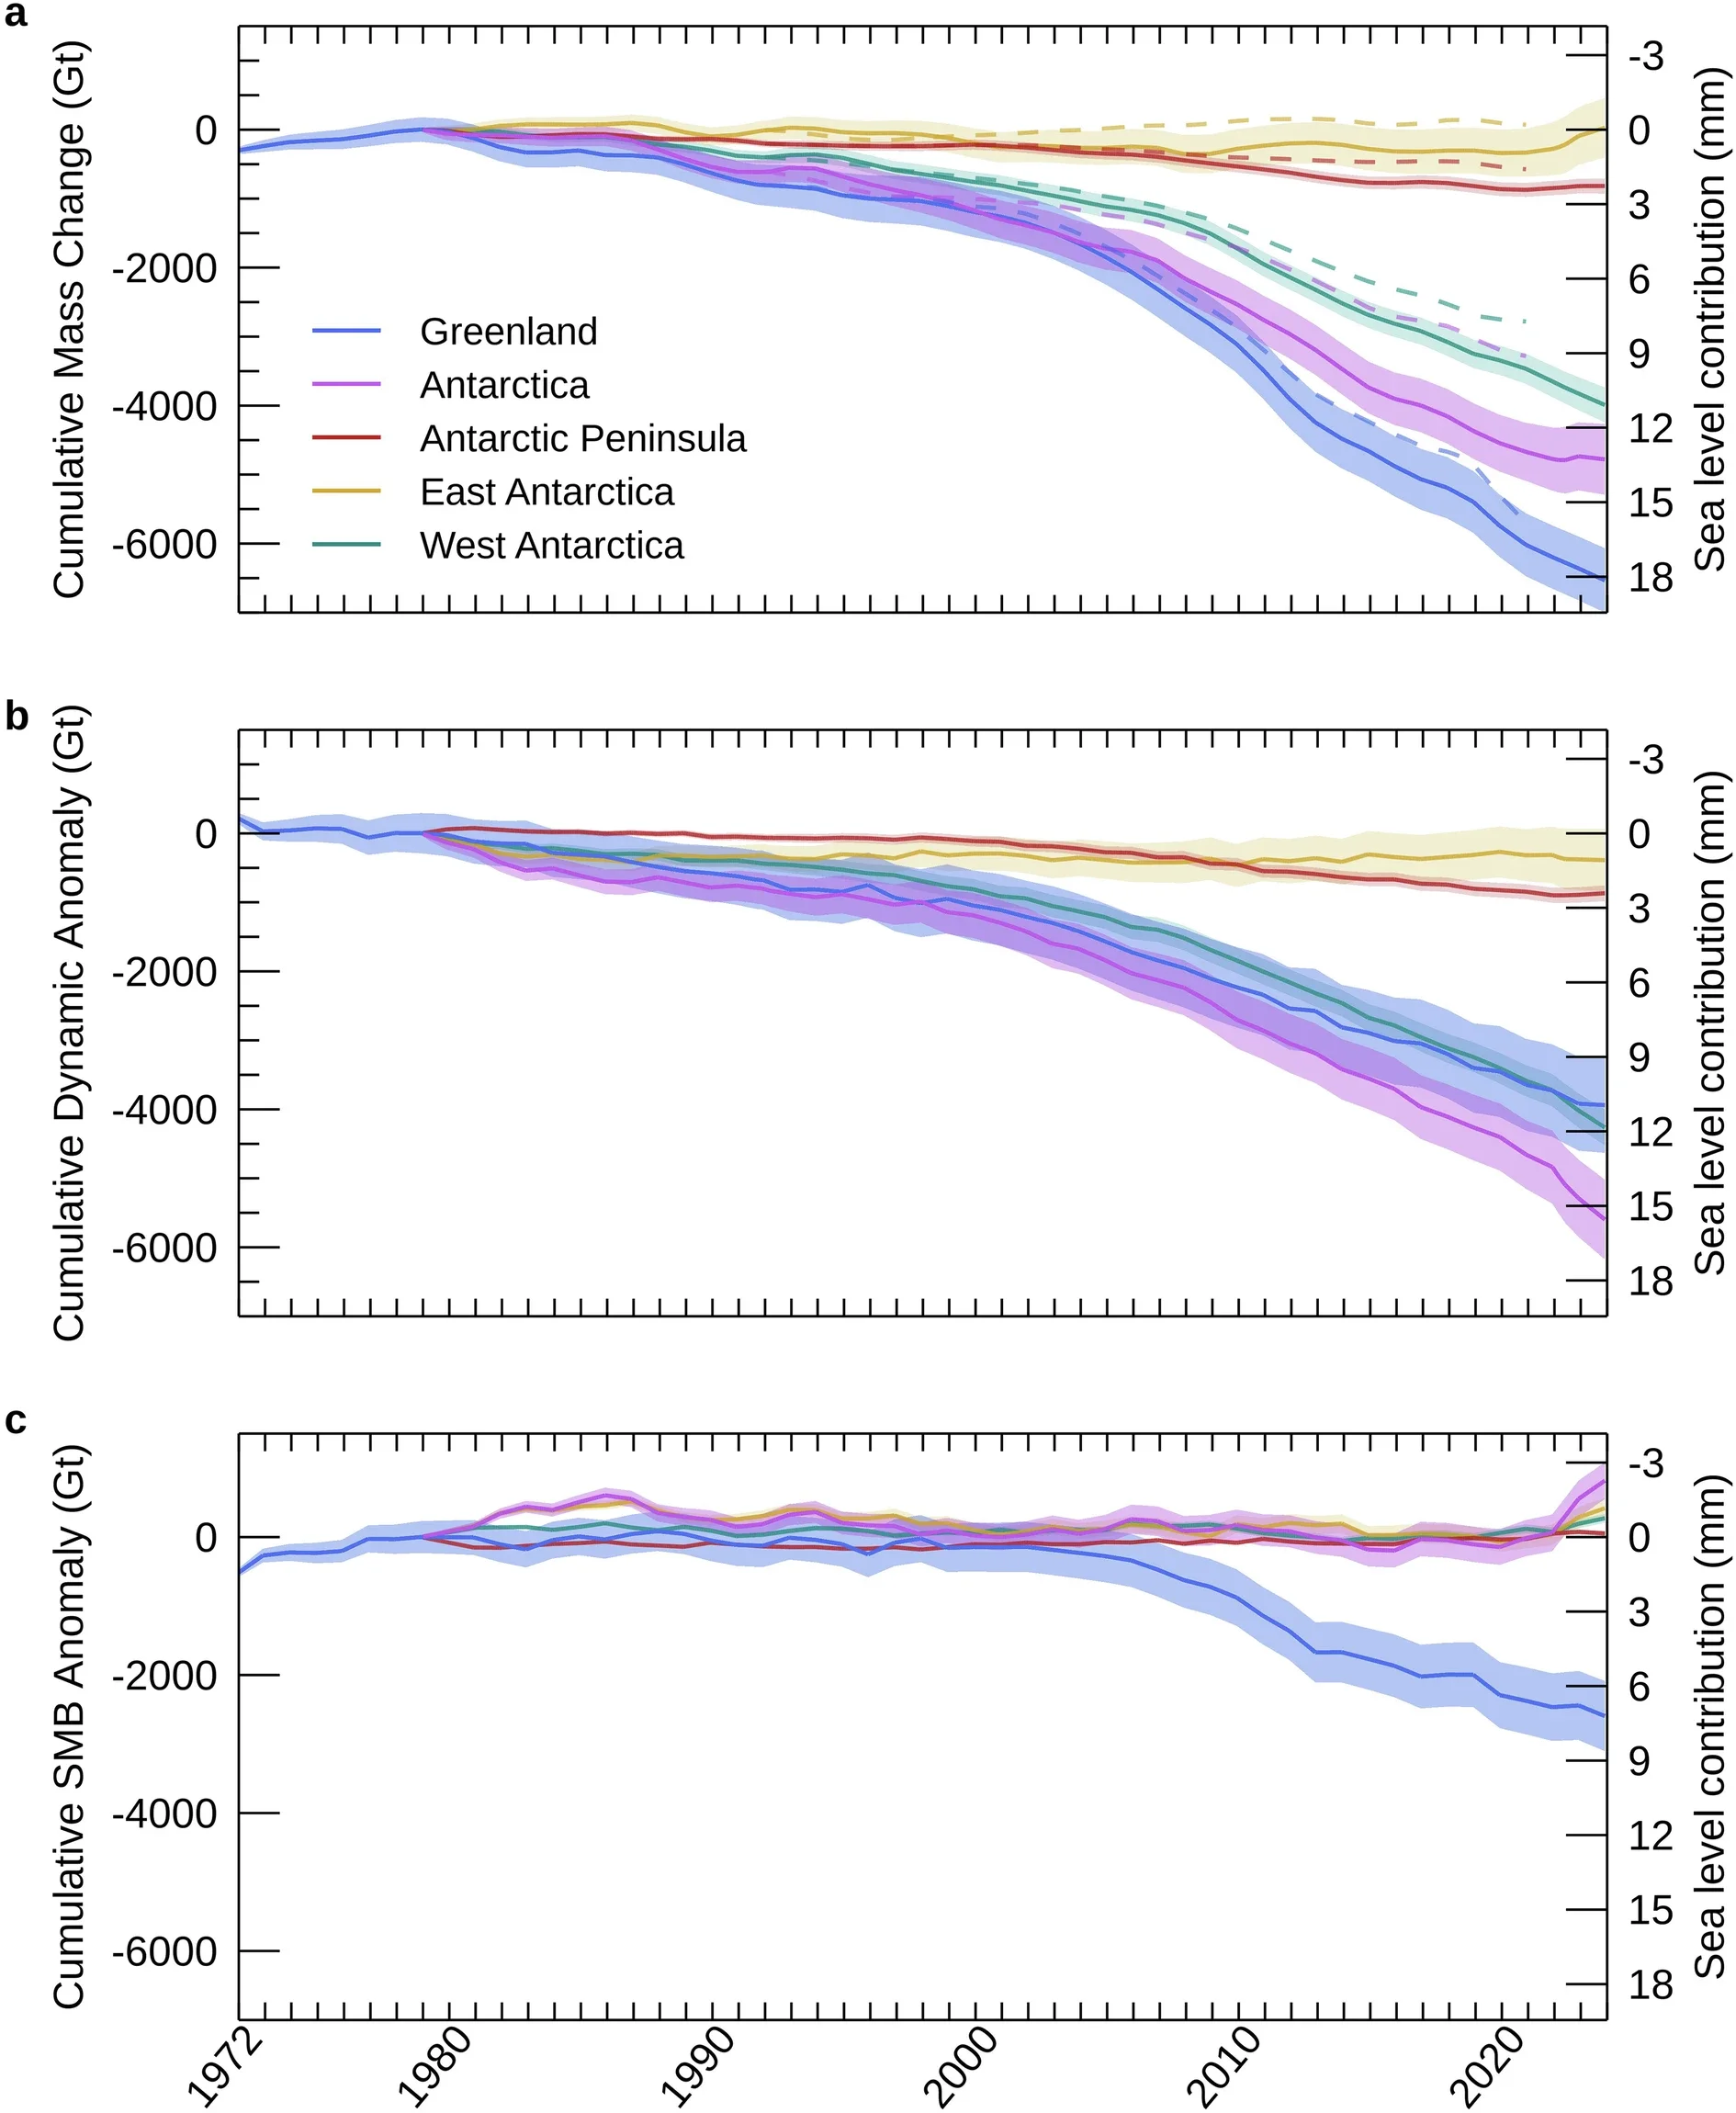
The two great ice sheets lost about 11.3 trillion metric tons of ice between 1979 and 2023, according to a new international assessment published in Scientific Data. The lost ice added approximately 3.1 centimeters, or about 1.2 inches, to global sea levels.
The analysis extends the satellite record farther into the past than previous combined assessments and brings together measurements from 27 satellite missions and 45 independent surveys.
Its most troubling finding is not simply how much ice has disappeared, but how it is being lost. About 84% of the combined decline came from changing glacier dynamics as ice flowed more rapidly toward the ocean.
“The ice sheets are melting away fast,” said University of California, Irvine ice scientist Eric Rignot, a study co-author. “We are melting the polar regions, sea level is rising worldwide and will exacerbate the vulnerability of coastal regions.”
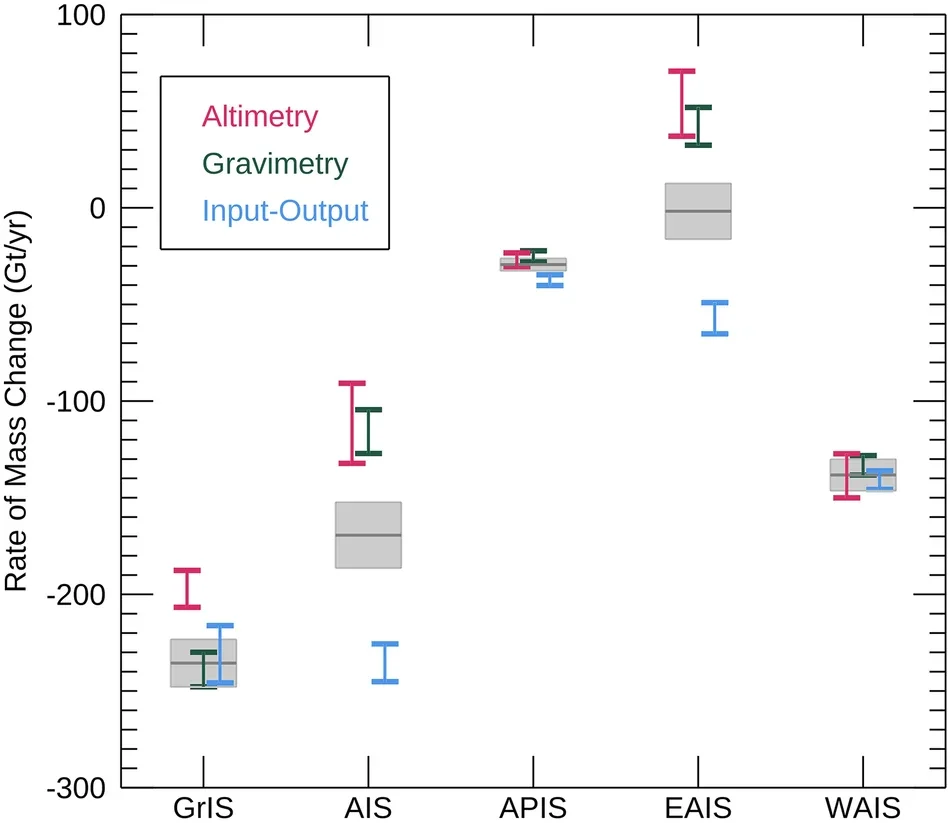
Scientists monitor ice sheets using several independent techniques.
Satellite altimeters measure changes in surface elevation. Gravity missions detect changes in the amount of mass below them, while radar and optical instruments track how quickly glaciers flow toward the sea.
Combining those methods gives researchers a way to reconstruct changes over decades while reducing dependence on any single measurement technique.
Earlier international assessments concentrated largely on the period beginning in the 1990s. By incorporating older NASA and other satellite observations, the new dataset stretches Greenland measurements back to 1972 and Antarctic measurements to 1979.
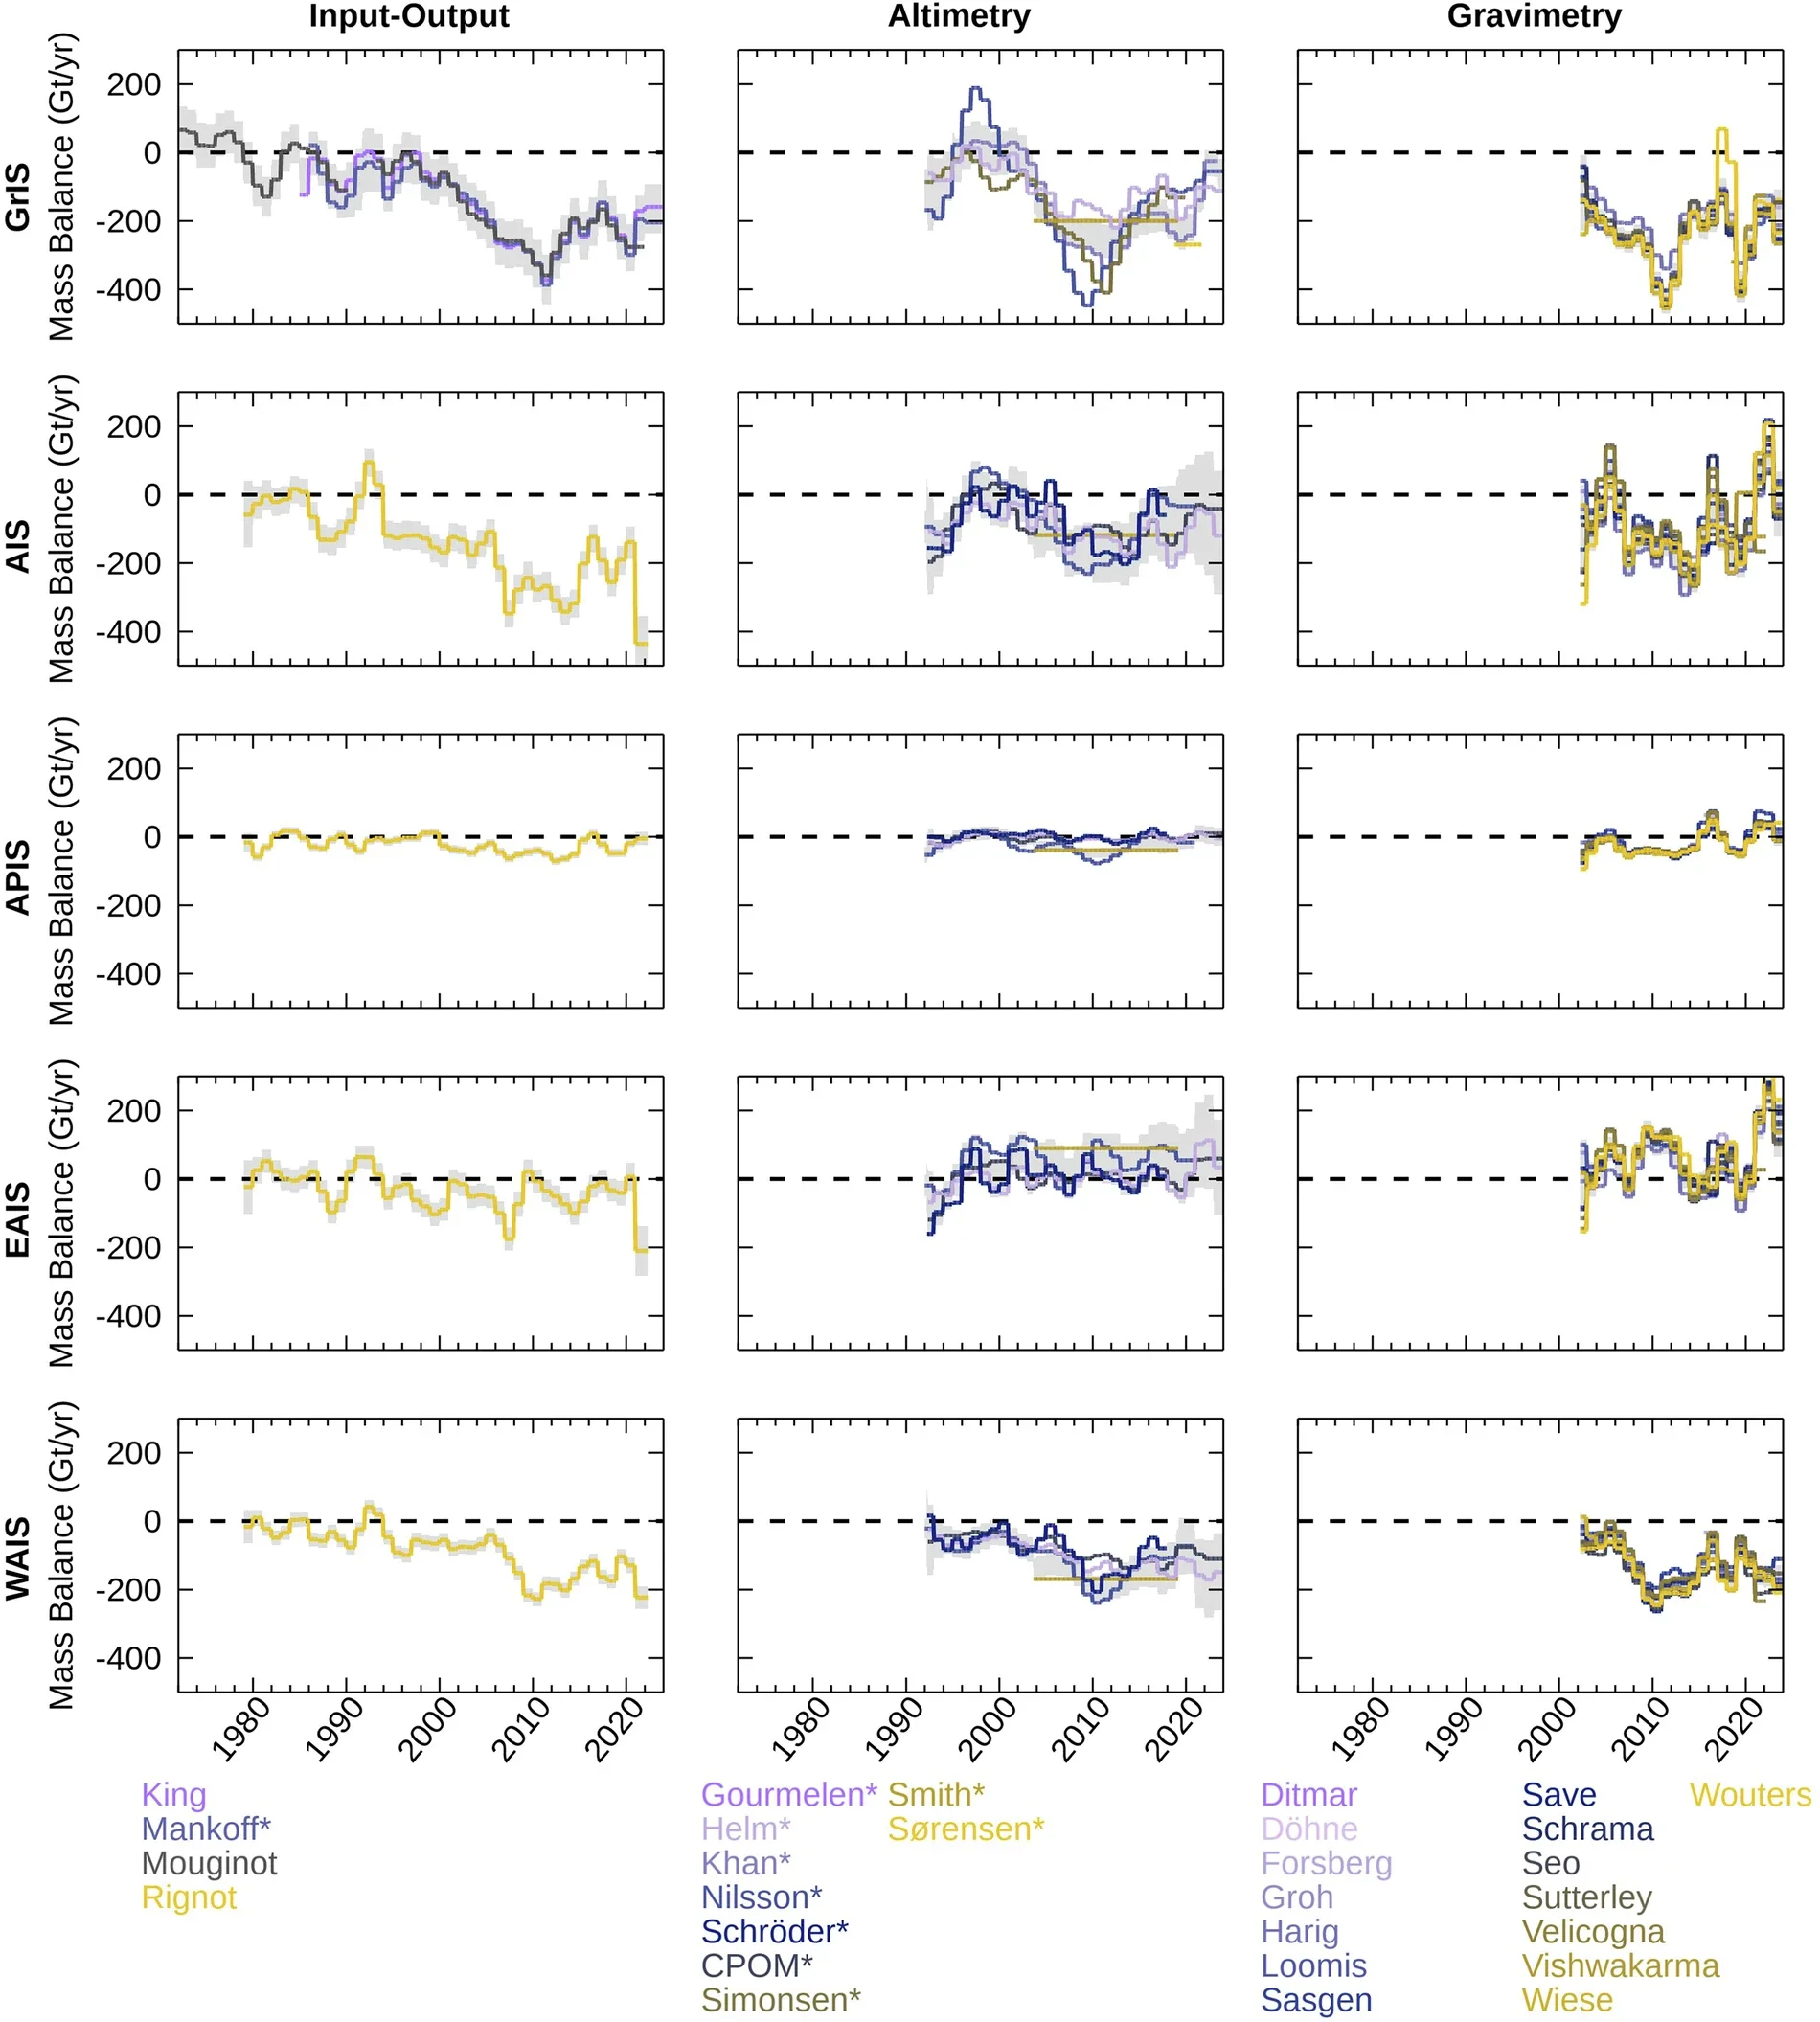
The combined record shows relatively modest losses early on, followed by increasingly negative balances as the climate warmed.
“There is a clear trend that the ice sheets are losing more mass and it has been increasing from decade to decade,” lead author Ines Otosaka of Northumbria University said.
The acceleration became particularly pronounced during the 2000s and 2010s.
Ice sheets gain mass mainly when snow accumulates. They lose it through surface melting, runoff and the movement of glaciers into the ocean.
The new assessment separates those contributions.
Between 1979 and 2023, Greenland and Antarctica together lost about 11,309 billion metric tons of ice. Roughly 84% resulted from ice-dynamical imbalance, while about 16% came from reduced surface mass balance.
That distinction matters because dynamic losses can respond strongly to warming oceans.
Many glaciers terminate in seawater, where warmer ocean water can melt ice from below or weaken floating ice shelves that restrain glaciers farther inland. Once that resistance decreases, inland ice can accelerate toward the coast.
Greenland alone lost about 6,215 billion metric tons between 1972 and 2023. About 67% of that loss came from increased ice discharge and 33% from changes in surface mass balance.
Antarctica lost about 4,780 billion metric tons between 1979 and 2023. The assessment attributed its net loss entirely to ice dynamics.
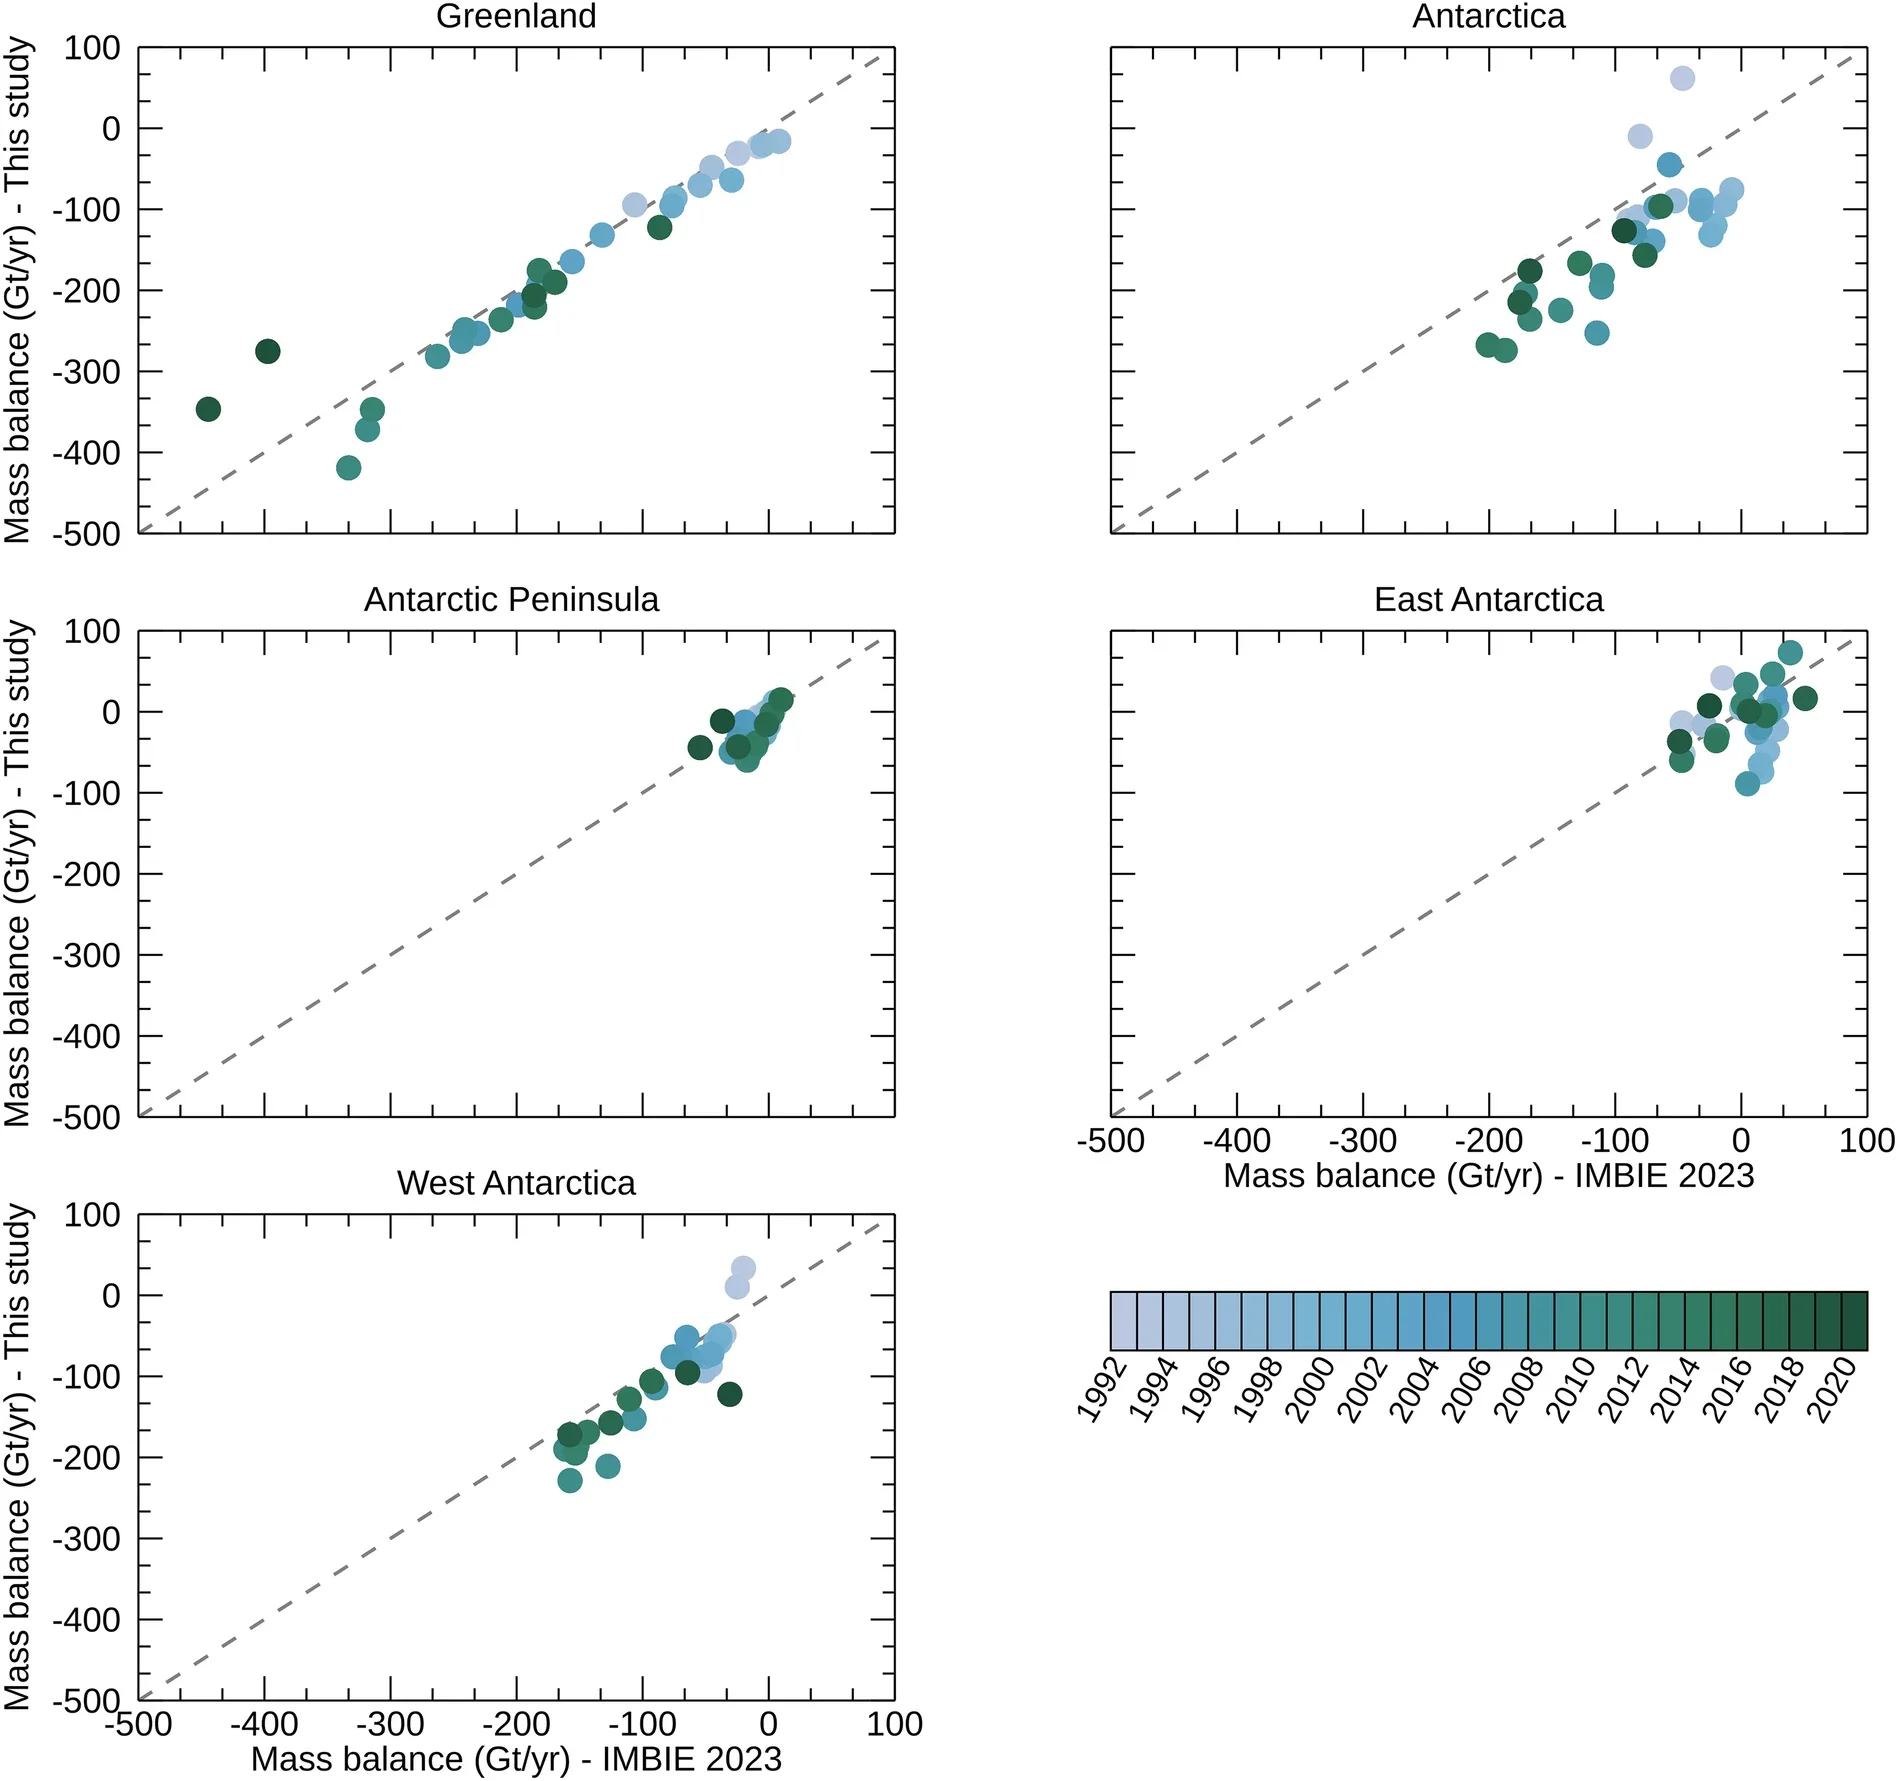
The strongest Antarctic losses have occurred in West Antarctica.
Ice discharge there increased in every decade covered by the record, rising from about 29 ± 7 billion metric tons per year during the 1980s to 163 ± 12 billion tons per year in the 2010s.
That region attracts particular attention because much of its ice rests on bedrock below sea level. Retreat can expose thicker ice farther inland and potentially allow continued glacier withdrawal.
New York University glaciologist David Holland, who was not involved in the study, said the dominance of dynamic ice loss is especially important when considering possible instability.
That does not mean a rapid continent-wide collapse is underway. Ice-sheet responses unfold over long periods and vary dramatically from one region to another.
But dynamic processes remain among the largest uncertainties in long-term sea-level projections because they can accelerate faster than surface melting alone.
The record contains an apparent break from accelerating losses between 2020 and 2023.
Researchers caution against interpreting that period as a reversal.
East Antarctica received exceptionally heavy snowfall in 2022 and 2023, producing a substantial short-term mass gain. The Antarctic Peninsula also moved close to balance because of increased snowfall and reduced ice discharge.
As a result, Antarctica’s overall loss rate during 2020 through 2023 was more than three times smaller than during the 2010s.
Greenland also experienced fewer extreme summer melt events during those years. Its average loss rate fell to about 199 ± 29 billion metric tons annually, compared with 264 ± 18 billion tons per year during the 2010s.
Rignot described the pause as “just a bump in the record.”
The distinction between weather and climate is important. Snowfall can vary widely from one year to another, while the underlying warming trend continues over decades.
An additional 3.1 centimeters of global sea level may sound modest, but even small increases raise the baseline from which storm surges and high tides begin.
Otosaka noted that each centimeter of sea-level rise can expose millions more people to annual flooding.
The ice sheets are also not the only source of rising seas. Mountain glaciers, thermal expansion of seawater and changes in terrestrial water storage also contribute.
Greenland and Antarctica nevertheless represent one of the biggest long-term uncertainties because they contain enough ice to raise sea level by many meters if large portions were eventually lost.
The new assessment does not predict when such changes might occur. Instead, it strengthens the observational record needed to test ice-sheet models and improve future projections.
The clearest message from more than four decades of satellite measurements is that the ice sheets have shifted from relative stability toward sustained loss.
That shift is already raising oceans, and the response of Greenland and Antarctica to past warming suggests the consequences will continue unfolding for decades.
These studies provide additional context on long-term ice-sheet change, glacier dynamics and future sea-level risk.
Mass balance of the Greenland and Antarctic ice sheets from 1992 to 2020: This earlier IMBIE assessment reconciled multiple satellite techniques to measure how Greenland and Antarctica contributed to sea-level rise over nearly three decades. (Earth System Science Data, 2023)
Projected land ice contributions to twenty-first-century sea level rise: This study combined international ice-sheet and glacier projections to estimate their possible contributions to sea-level rise under different warming scenarios. (Nature, 2021)
Pervasive ice sheet mass loss reflects competing ocean and atmosphere processes: Satellite altimetry showed how ocean-driven glacier losses and atmospheric snowfall changes affect different parts of Greenland and Antarctica. (Science, 2020)
Ubiquitous acceleration in Greenland Ice Sheet calving from 1985 to 2022: Researchers documented widespread acceleration in Greenland glacier retreat and calving over nearly four decades. (Nature, 2024)
Four decades of Antarctic Ice Sheet mass balance from 1979–2017: This long-term reconstruction traced Antarctic mass loss back to 1979 and highlighted the growing importance of ocean-driven ice discharge. (Proceedings of the National Academy of Sciences, 2019)
Research findings are available online in the journal Scientific Data.
The original story “Greenland and Antarctica have lost more than 11 trillion tons of ice since 1979” is published in The Brighter Side of News.
Like these kind of feel good stories? Get The Brighter Side of News’ newsletter.
The post Greenland and Antarctica have lost more than 11 trillion tons of ice since 1979 appeared first on The Brighter Side of News.


Leave a comment
You must be logged in to post a comment.